Gold Price Forecast: XAU/USD tug-of-war around $1,950, Fed clues eyed – Confluence Detector
- Gold Price struggles for clear directions amid full markets, mixed catalysts.
- PBoC rate cut justifies fears surrounding China economic woes, weigh on XAU/USD price.
- Retreat in yields put a floor under the Gold Price ahead of Fed Chair Jerome Powell’s Testimony, PMI.
Gold Price (XAU/USD) fades two-day-old bearish bias as it recovers from intraday low amid full market’s return. Even so, the yellow metal appears indecisive as a whole amid the mixed catalysts surrounding the US Federal Reserve (Fed) and China, as well as market’s inaction.
That said, fears of China’s economic slowdown gain momentum after the People's Bank of China (PBoC) cuts its benchmark Loan Prime Rates (LPRs) by 10 basis points (bps), matching market expectations. On the previous day, multiple top-tier banks, including Goldman Sachs and JP Morgan, downwardly revised China growth forecasts and raised fears of easy energy demand, considering China’s status as one of the world’s biggest gold consumers.
On the other hand, monetary policy officials from the European Central Bank (ECB) and the Fed have been hawkish so far and hence flag fears of the global economic slowdown, which in turn weigh on the Gold Price.
Moving on, major attention will be given to Fed Chair Jerome Powell’s Testimony and preliminary readings of June’s PMIs for a clear short-term view.
Also read: Gold Price Forecast: For how long will 100 DMA guard the XAU/USD downside?
Gold Price: Key levels to watch
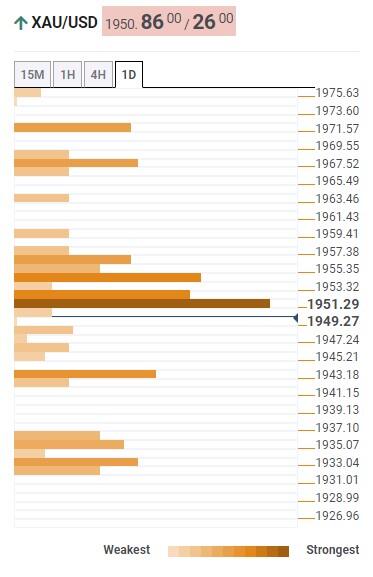
Our Technical Confluence Indicator suggests that the Gold Price remains sidelined near the $1,950 key level, recently piercing from below. That said, the hurdle comprises 5-DMA, Fibonacci 23.6% on the daily chart and middle band of the Bollinger on the four-hour chart
Apart from the $1,950 hurdle, the $1,955-56 zone can also act as an immediate resistance as it encompasses the Fibonacci 61.8% on the daily and the weekly chart, as well as the 10-DMA.
Following that, the Gold Price will have an open space to ride towards the north unless hitting the $1,968 hurdle and the previous weekly high of around $1,972.
Meanwhile, the Gold sellers need validation from the 100-DMA support of around $1,942, which also includes the Fibonacci 38.2% on the weekly chart.
In a case where the Gold Price drops below $1,942, the previous monthly low of around $1,933 can act as the final defense of the XAU/USD buyers.
Here is how it looks on the tool
About Technical Confluences Detector
The TCD (Technical Confluences Detector) is a tool to locate and point out those price levels where there is a congestion of indicators, moving averages, Fibonacci levels, Pivot Points, etc. If you are a short-term trader, you will find entry points for counter-trend strategies and hunt a few points at a time. If you are a medium-to-long-term trader, this tool will allow you to know in advance the price levels where a medium-to-long-term trend may stop and rest, where to unwind positions, or where to increase your position size.