Back
EUR/USD daily chart
EUR/USD 30-minute chart
19 Jul 2019
EUR/USD techncial analysis: Fiber near daily lows and 1.1220 post-Consumer Sentiment Index
- EUR/USD erased Fed’s William inspired gains seen on Thursday.
- The market is having no significant reaction after the release of the Michigan Consumer Sentiment Index.
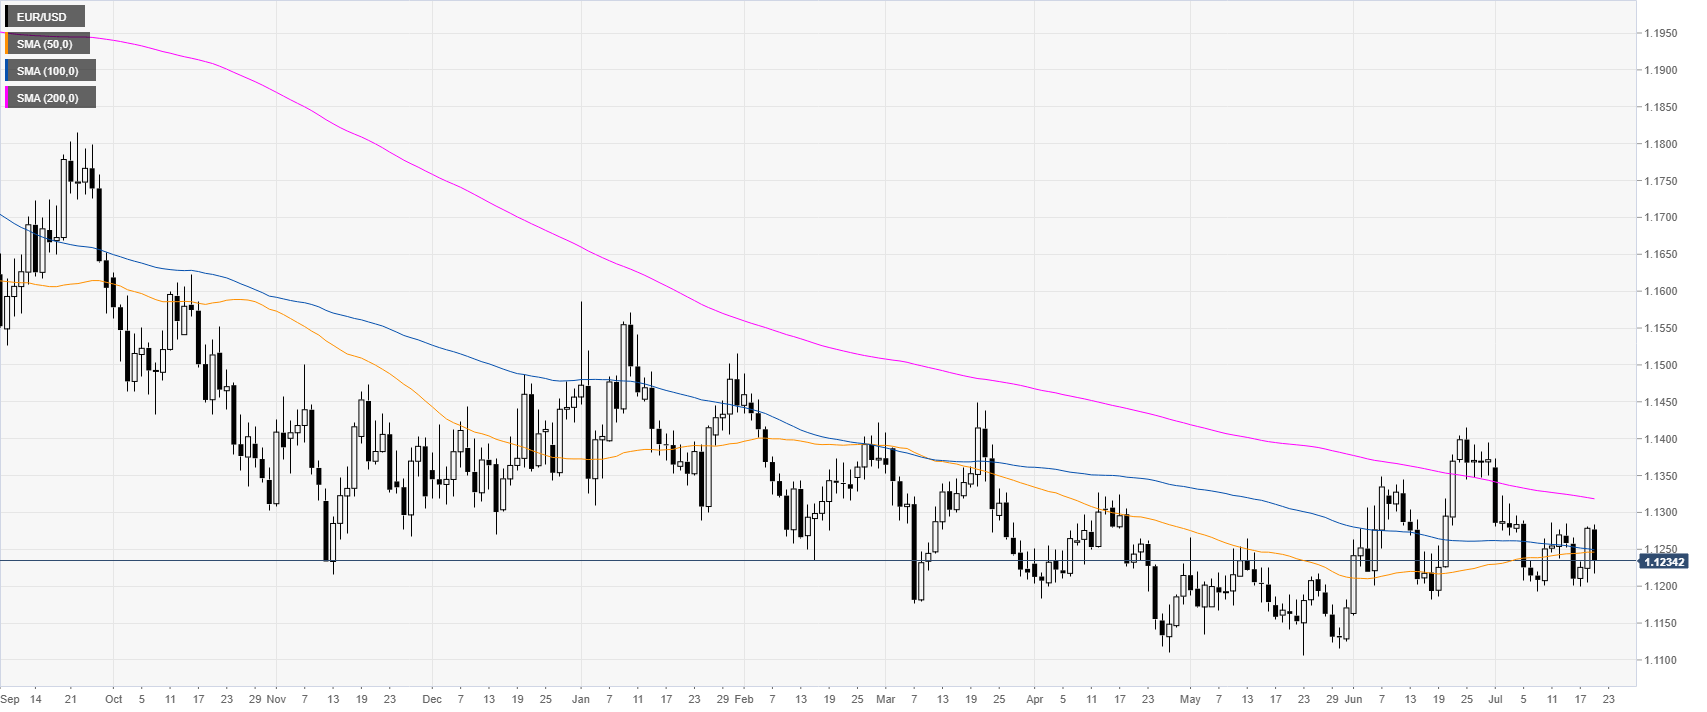
EUR/USD daily chart
EUR/USD is trading in a bear trend below its main daily simple moving averages (DSMAs). The Michigan Consumer Sentiment Index (July) came in just below expecation at 98.4 vs. 98.5 forecast.
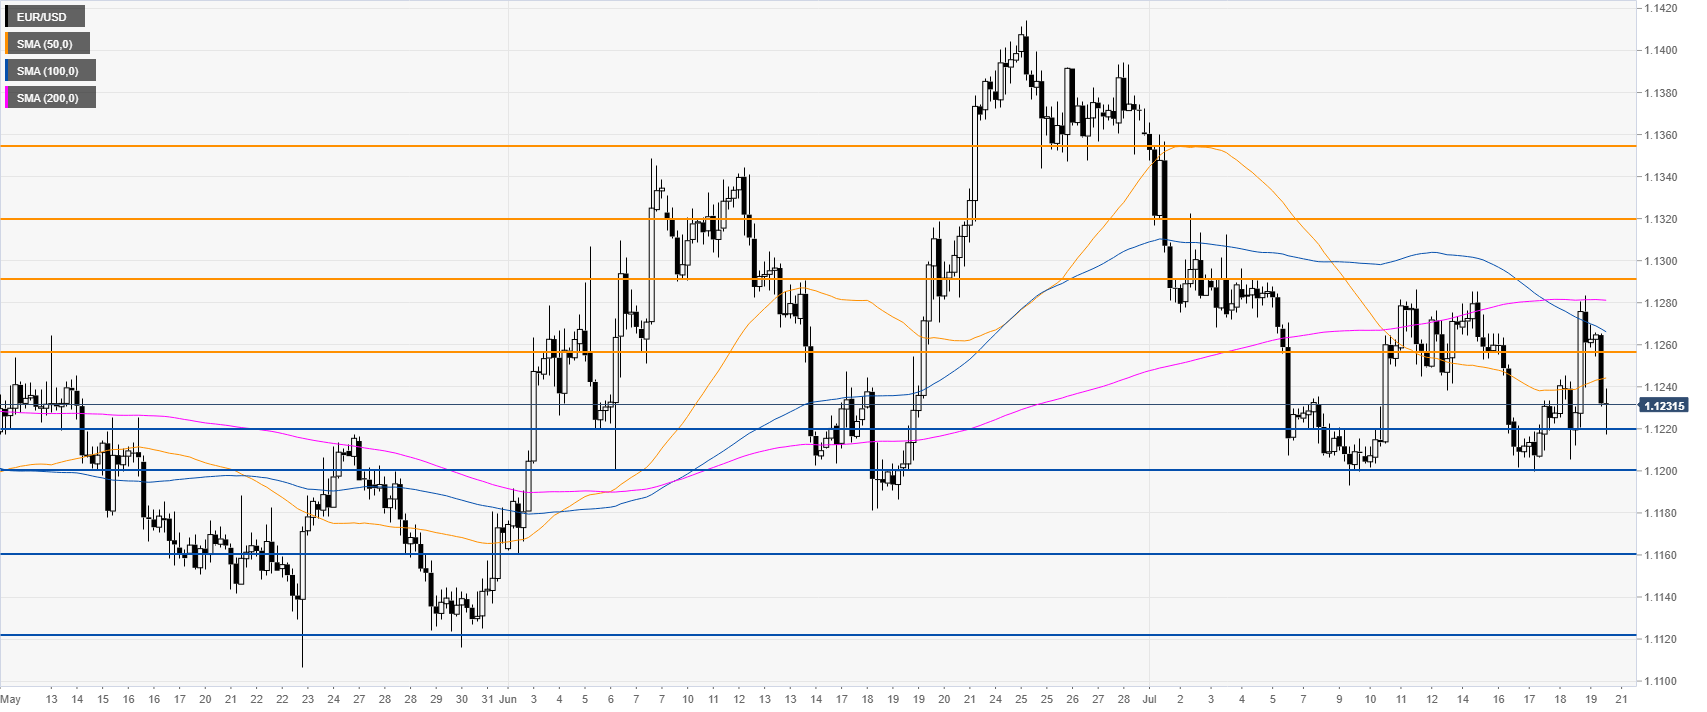
EUR/USD 4-hour chart
EUR/USD is challenging 1.1220 support while below the main SMAs. Bears want to break below the level and reach 1.1200 and 1.1160, according to the Technical Confluences Indicator.
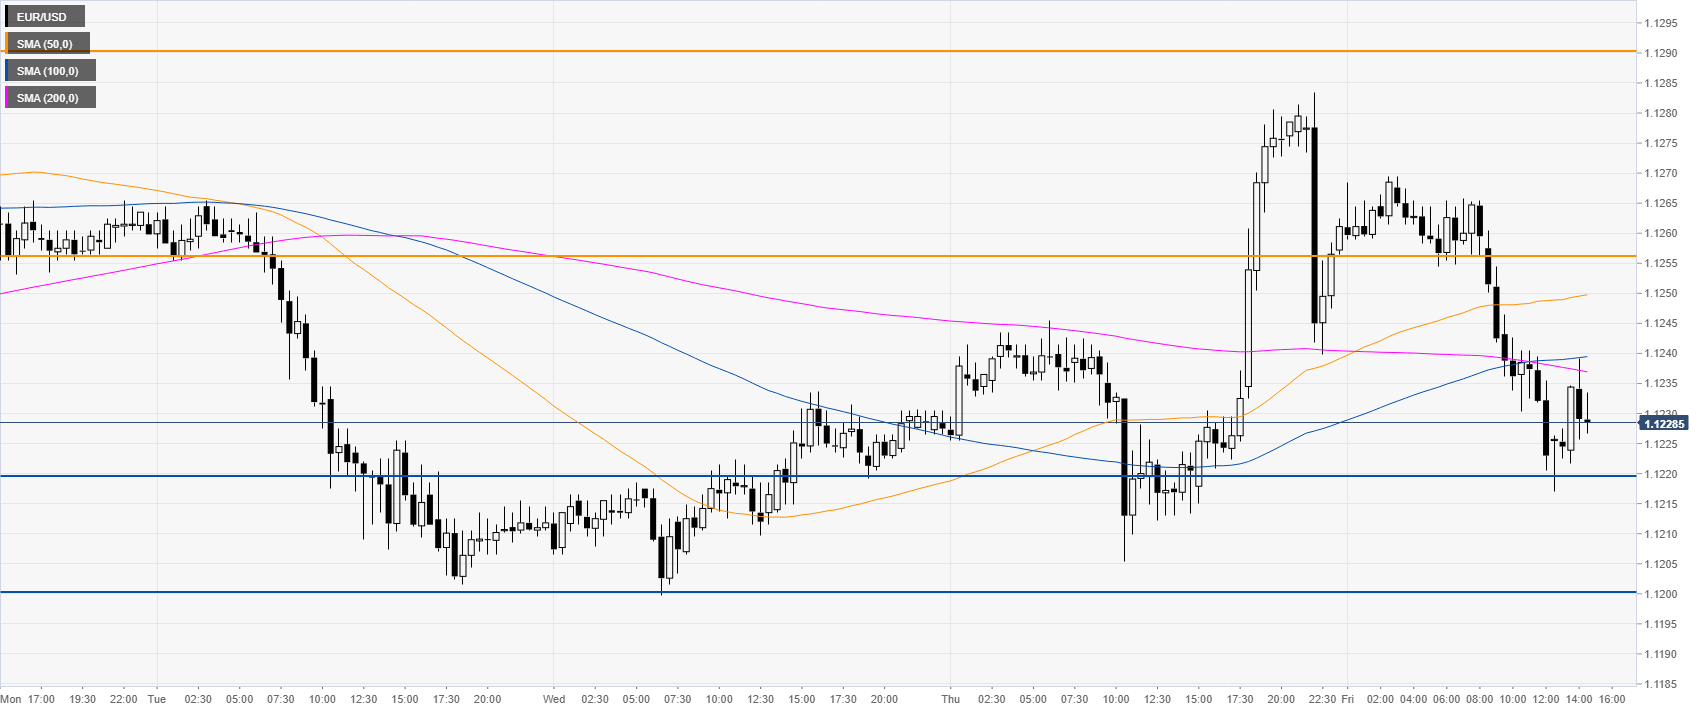
EUR/USD 30-minute chart
EUR/USD is trading below its main SMAs suggesting bearish momentum in the near term. Immediate resistance can be seen at 1.1255 and 1.1290, according to the Technical Confluences Indicator.
Additional key levels