USD/IDR Price Analysis: Pullbacks to 10-day SMA likely amid oversold RSI conditions
- USD/IDR struggles to decline below multi-month-old support lines.
- Monthly top, 200-day SMA will restrict upside beyond the short-term moving average.
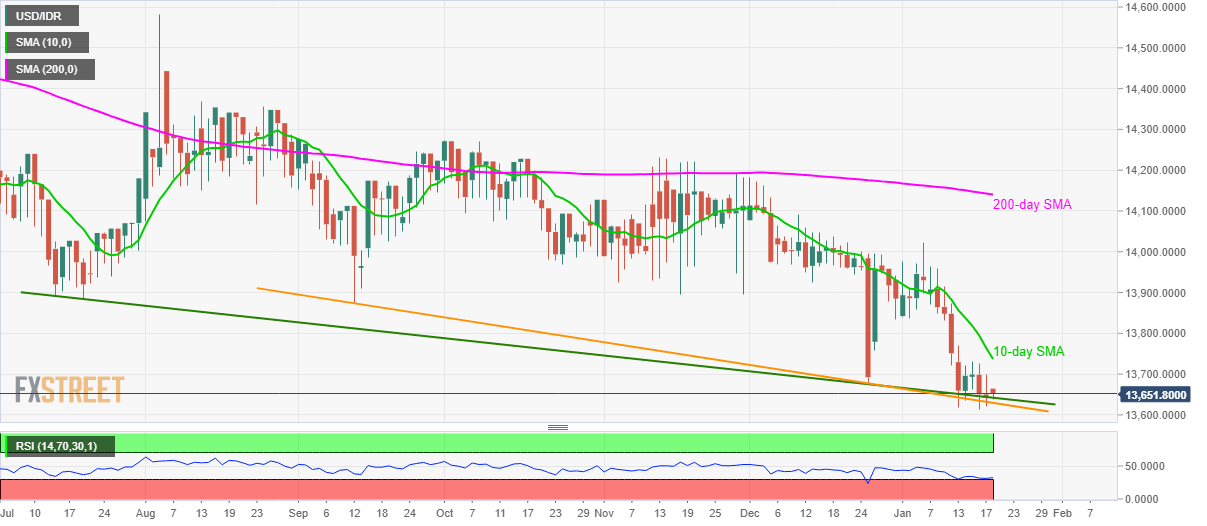
USD/IDR stays above the medium-term trend line supports while trading around 13,650 ahead of the European session on Monday. The pair has been struggling to extend its downpour below multi-month-old support-lines since December 13 wherein oversold conditions of RSI favor a pullback before further declines.
With this, a 10-day SMA level near 13,740 can please buyers during the recovery. However, the pair’s additional upside will be challenged by December 31 low near 13,835 and 14,000 round-figure.
Should prices manage to remain strong beyond 14,000, monthly top surrounding 14,025 and 200-day SMA level of 14,143 will be the key to watch.
In a case prices manage to register a daily closing below 13,630, mid-February 2018 low surrounding 13,500 cold lure the bears.
USD/IDR daily chart

Trend: Pullback expected
