Back
26 Feb 2020
Gold Price Analysis: XAU/USD easing from 2020 highs, trades near $1640.00/oz
- XAU/USD is consolidating gains below the 1660.00 level.
- Support is seen in the 1640.40/1622.00 band.
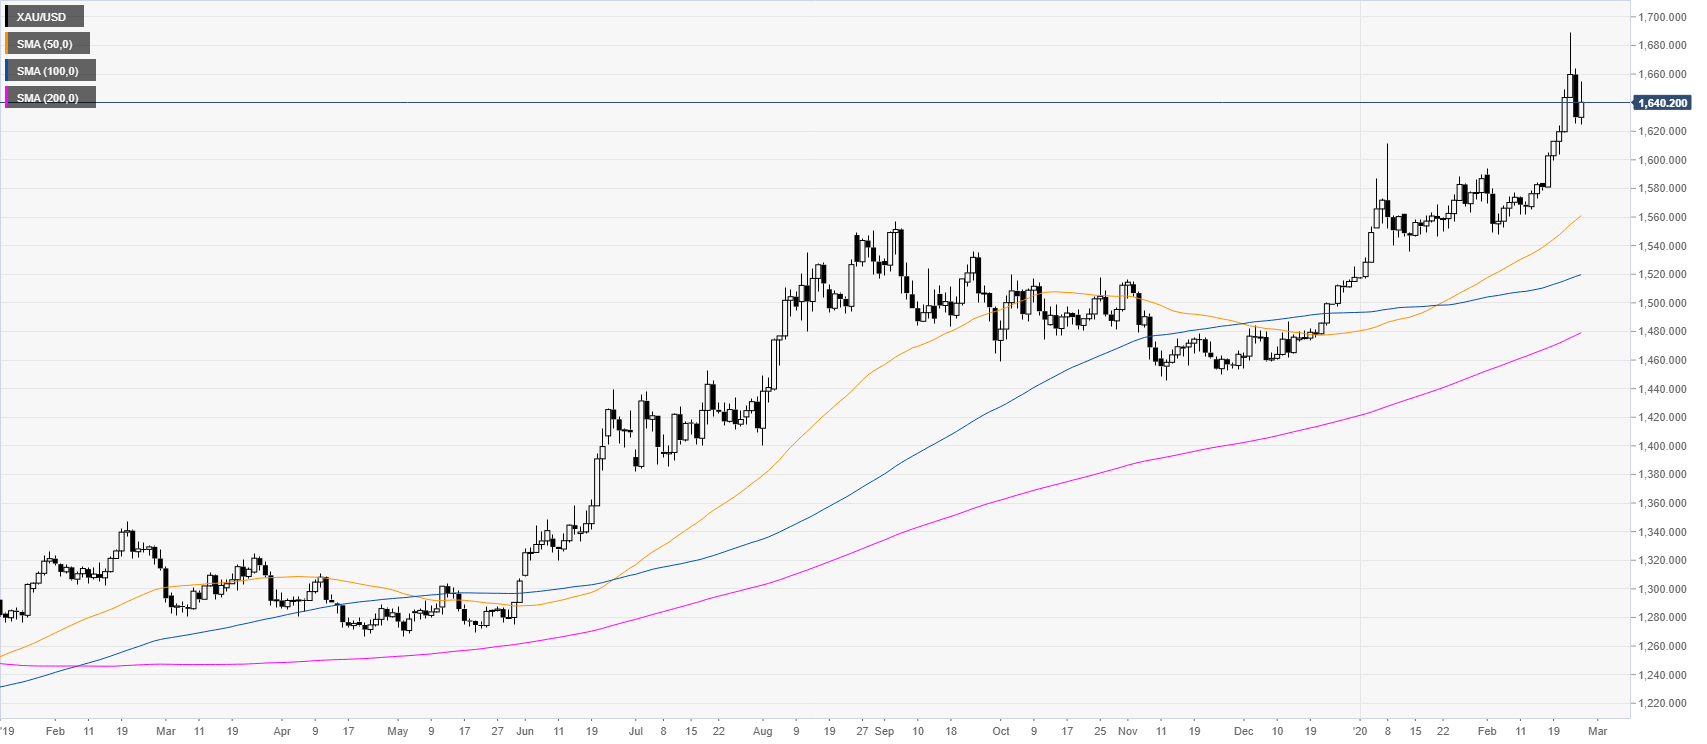
Gold daily chart
XAU/USD is trading in a bull trend above its main daily simple moving averages (SMAs) as the market is pulling back down from 2020 highs established two days ago.
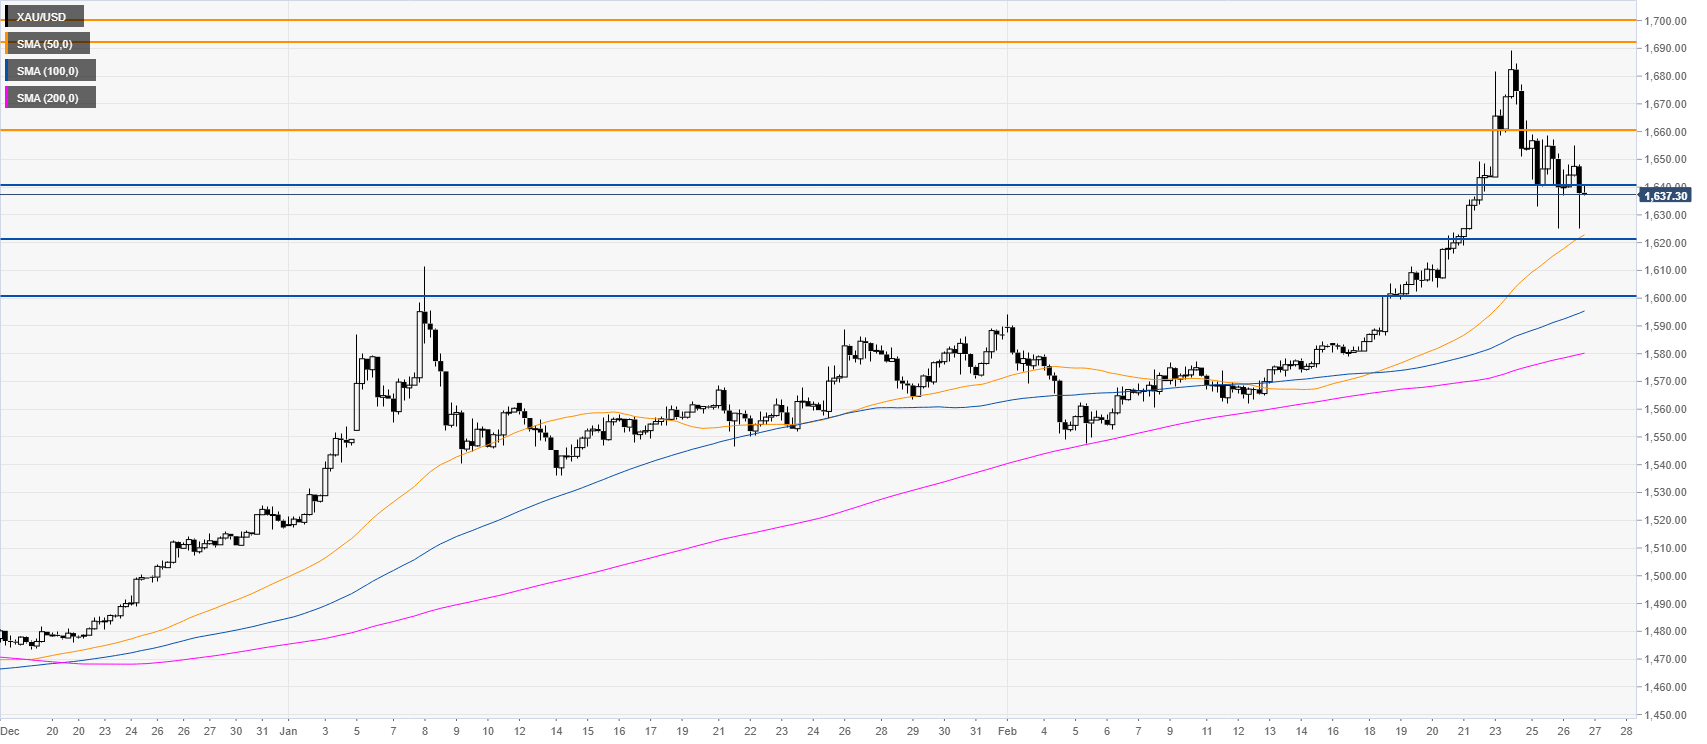
Gold four-hour chart
Gold is consolidating the recent gains while trading above the main SMAs on the four-hour chart. Bears want a daily close below the 1640.40 level to extend to bear move towards the 1622.00 and 1600.00 price levels. On the other hand, bulls would gain momentum on a break above the 1660.00 level en route towards the 1692.00 and 1700.00 resistances.
Resistance: 1660.00, 1692.00, 1700.00
Support: 1640.40, 1622.00, 1600.00
Additional key levels