EUR/JPY Price Analysis: Six-week-old support line in focus
- EUR/JPY prints six-day losing streak as sellers cheer downside break of 21-day SMA amid bearish MACD.
- A confluence of 50-day SMA, 38.2% Fibonacci retracement also becomes the key support.
- Bulls have multiple upside barriers even if they cross immediate SMA resistance.
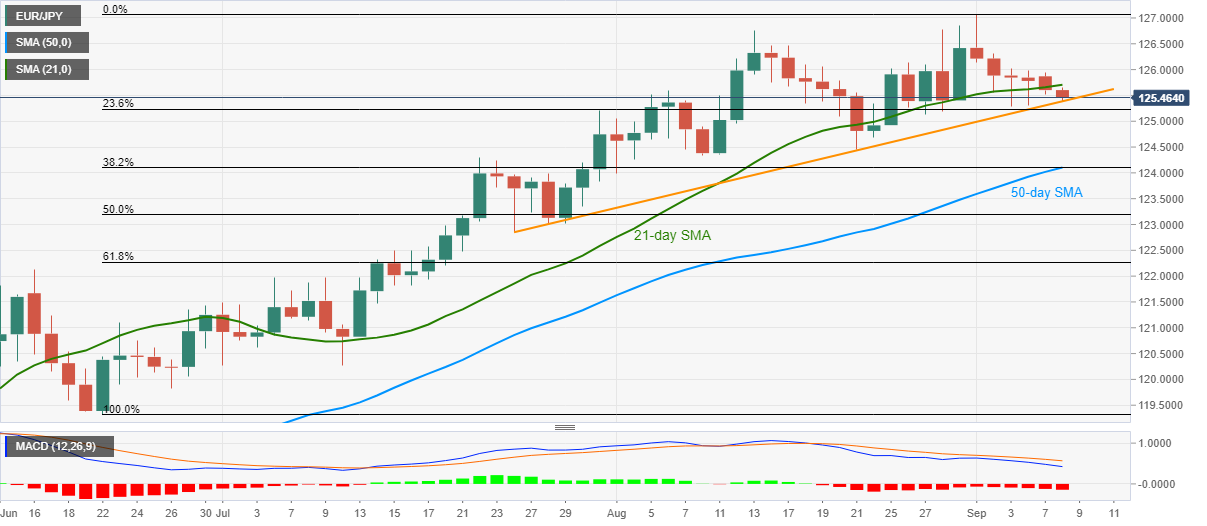
EUR/JPY remains on the back foot while trading around 125.50, down 0.11% on a day, during the early Tuesday. The pair currently rests near an ascending trend line from July 24 as the bears firm up the grip after breaking the 21-day SMA amid downbeat MACD conditions.
Hence, further, selling awaits a clear break of 125.38 support line figures to aim for August 21 low near 124.45.
However, a joint of 50-day SMA and 38.2% Fibonacci retracement of June-September upside, around 124.10, followed by 124.00 threshold, will restrict the pair’s additional downside.
On the contrary, an upside break of 21-day SMA, currently around 125.70 will have 126.00 and August 13 to near 126.75 before challenging the monthly top of 127.07.
In a case where the bulls manage to dominate past-127.07, March 2019 peak surrounding 127.50 will be the key.
EUR/JPY daily chart
Trend: Bearish