Gold Price Analysis: XAU/USD battles critical $1945 ahead of ECB, levels to watch – Confluence Detector
Gold (XAU/USD) consolidates Wednesday’s rebound, as the bulls take a breather heading into the European Central Bank (ECB) monetary policy decision. The dollar took a hit following a bounce in the Wall Street indices, fuelled by the tech rally.
The yellow metal also cheered the optimism over the US stimulus deal after the Senate Republicans proposed a smaller relief package. All eyes remain on the crucial ECB policy decision for any dovish stance, which could boost the yieldless gold. How is it positioned on the charts?
Gold: Key resistances and supports
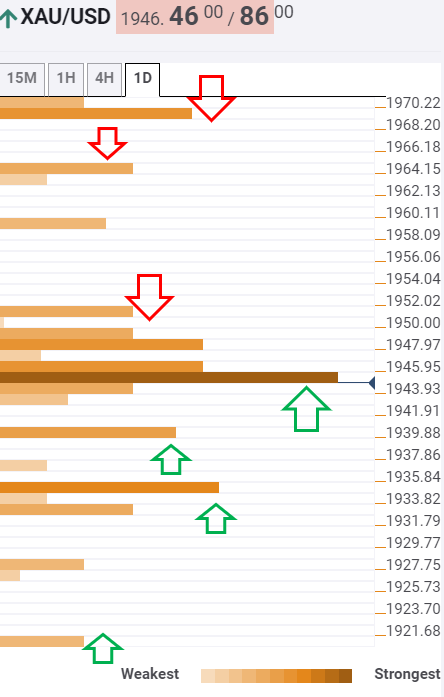
Having faced rejection above $1950, gold has returned to the critical $1945 level, a cluster of healthy support levels, including the Fibonacci 38.2% one-month, SMA10 one-day and SMA100 four-hour.
To the upside, the immediate cap awaits at $1950, the previous day high, above which the bulls could eye the pivot point one-day R1 at $1959.
The next upside barrier is aligned at $1964, the Fibonacci 61.8% one-week while the pivot point one-day R2 at $1970 will be the level to beat for the XAU bulls.
On the flip side, the convergence of the Fibonacci 38.2% one-day and SMA100 on 15-minutes could cushion the downside.
Should the selling pressure accelerate, the next support at $1934 will be tested. That level is the intersection of the Fibonacci 23.6% one-week and SMA5 one-day.
Minor support around $1930 will come into play next, which is the Fibonacci 61.8% one-day. The previous day low of $1920 will then be tested by the sellers.
Here is how it looks on the tool
About the Confluence Detector
With the TCI (Technical Confluences Indicator) tool, you can easily locate areas where the price can find a support zone or resistance zone and make trading decisions. If you are a short-term trader, you will find entry points for counter-trend strategies and hunt a few points each time. If you are a medium- and long-term trader, this tool will allow you to know in advance the price levels in which a medium / long-term trend can stop your travel and rest, where to undo positions or where to increase your position.
Learn more about Technical Confluence