WTI Price Analysis: Keeps recovery moves from short-term EMAs to battle $53.00
- WTI picks up bids while keeping the previous day’s recovery moves.
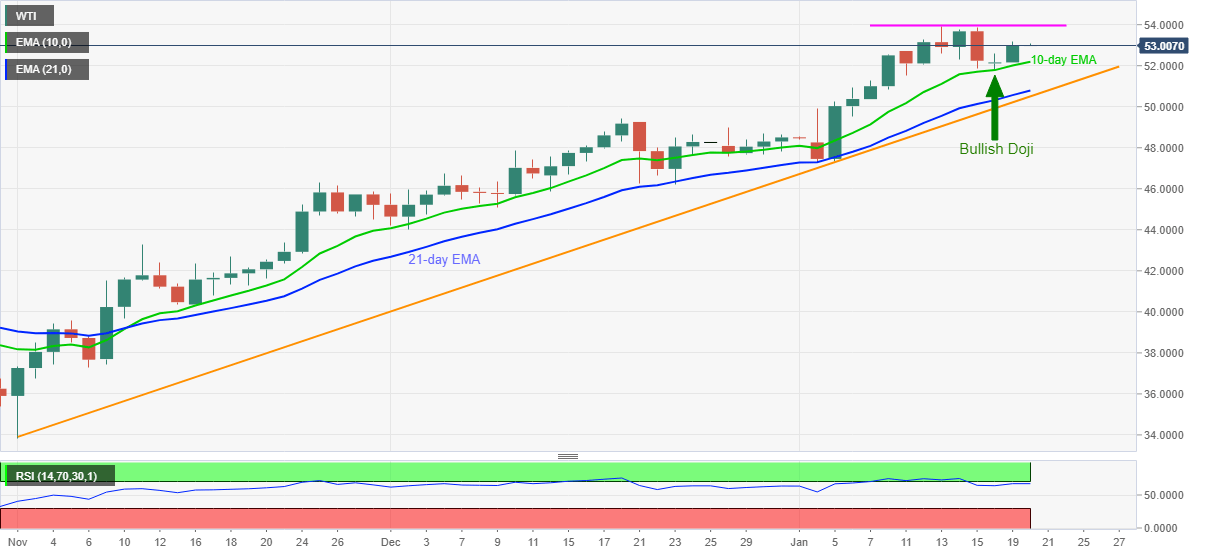
- Monday’s bullish Doji backs sustained trading beyond key supports.
- RSI conditions can challenge bulls around monthly high.
WTI rises to $53.12 during the initial Asian session trading on Wednesday. In doing so, the energy benchmark extends Tuesday’s recovery moves from 10-day SMA while staying above 21-day SMA and an upward sloping trend line from early November.
Considering the strong RSI conditions, a bit lower than the overbought area, coupled with the quote’s successful trading above key support, a continuation of the uptrend can’t be ruled out. It should also be noted that Monday’s bullish Doji formation also favors the black gold’s further rise.
However, the $53.86-93 area comprising the monthly high, followed by the $54.00 round-figure will challenge the WTI buyers.
Should RSI stay away from the overbought area beyond the $54.00 threshold, February 2020 top near $54.70 will gain the market’s attention.
Alternatively, a downside break of 10-day EMA, currently around $52.20, needs to defy Monday’s doji with a clear decline below $51.80 to convince short-term sellers.
Even so, 21-day EMA and the stated support line, respectively near $50.80 and $50.50, will challenge the WTI sellers ahead of the $50.00 psychological magnet.
To sum up, WTI justifies its upside momentum while staying above key short-term support amid strong RSI conditions, which in turn directs the energy buyers towards the early 2020 tops.
WTI daily chart

Trend: Bullish
