EUR/USD Price Analysis: Prints falling wedge around key support line near 1.1800
- EUR/USD remains pressured at three month low, after three-day downtrend.
- Bullish chart pattern around important support line keeps buyers hopeful.
- Momentum indicator tames bullish hopes, 200-DMA adds to the upside barrier.
EUR/USD stays depressed around 1.1800, near the lowest since early April, amid the initial Asian session trading on Tuesday. In doing so, the currency major pair portrays a bullish chart pattern, falling wedge, after a three-day fall while also challenging a crucial support line stretched from November.
Given the downbeat Momentum line, the bulls are less likely to find a way and hence further weakness becomes well expected.
However, a daily closing below the stated support line, around 1.1765 will be probed by the lower line of the wedge, near 1.1730, before a likely free fall to the yearly low surrounding the 1.1700 threshold.
In a case where the EUR/USD bears keep the reins past 1.1700, the November 2020 lows near 1.1600 will be in the spotlight.
On the contrary, a surprise up-move, or consolidation, needs to cross the wedge’s upper line at 1.1835 to renew bullish hopes targeting the 200-DMA level of 1.2008.
If at all the EUR/USD up-moves remain intact beyond 1.2008, lows marked in May and early June around 1.2050 and 1.2100 should return to the chart.
EUR/USD: Daily chart
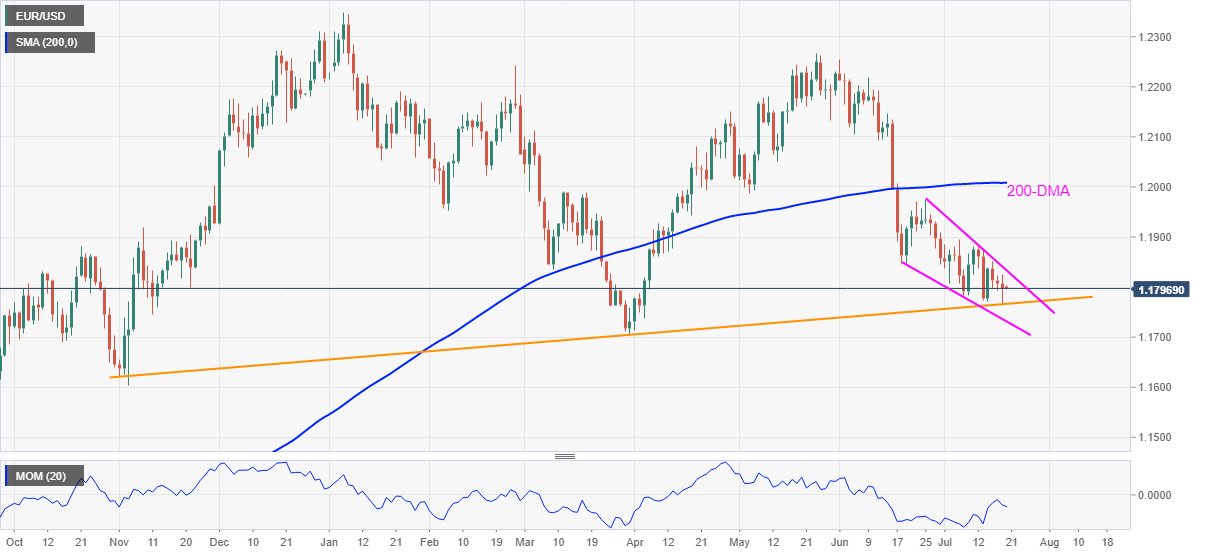
Trend: Bearish