AUD/USD Price Analysis: Off 20-SMA to reverse post-RBA losses below 0.7100
- AUD/USD consolidates RBA-linked losses, bounces off short-term SMA.
- Weekly resistance line, descending trend line from January 13 tests buyers.
- Bears keep eyes on recent lows until witnessing a daily closing beyond 50-DMA.
AUD/USD picks up bids to 0.7070 while reversing the post-RBA losses heading into Tuesday’s European session.
Read: AUD/USD drops towards 0.7000 as RBA tames rate-hike concerns despite ceasing QE
In doing so, the Aussie pair bounces off 20-SMA on the four-hour chart, around 0.7030 at the latest, to aim for a downward sloping resistance line from January 20, at 0.7085 by the press time.
AUD/USD: Four-hour chart
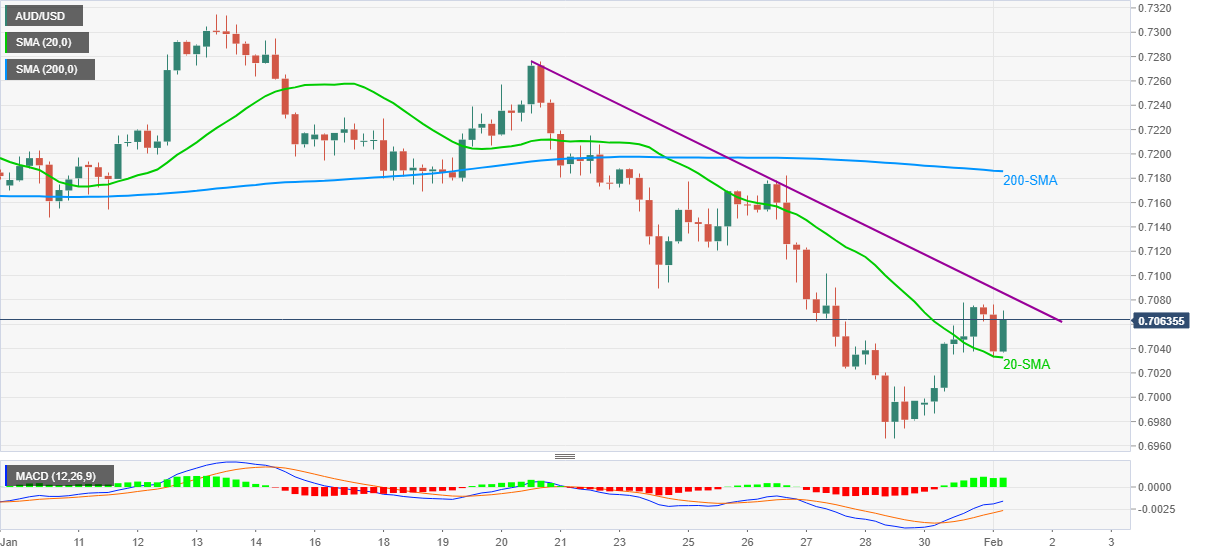
It’s worth noting that the quote’s ability to cross the 0.7085 hurdle will favor AUD/USD bulls to battle the 13-day-old resistance line near 0.7130.
However, the 50-DMA level near 0.7165 and the 200-SMA on the four-hour (4H) chart, close to 0.7185, will challenge the AUD/USD buyers afterward.
AUD/USD: Daily chart
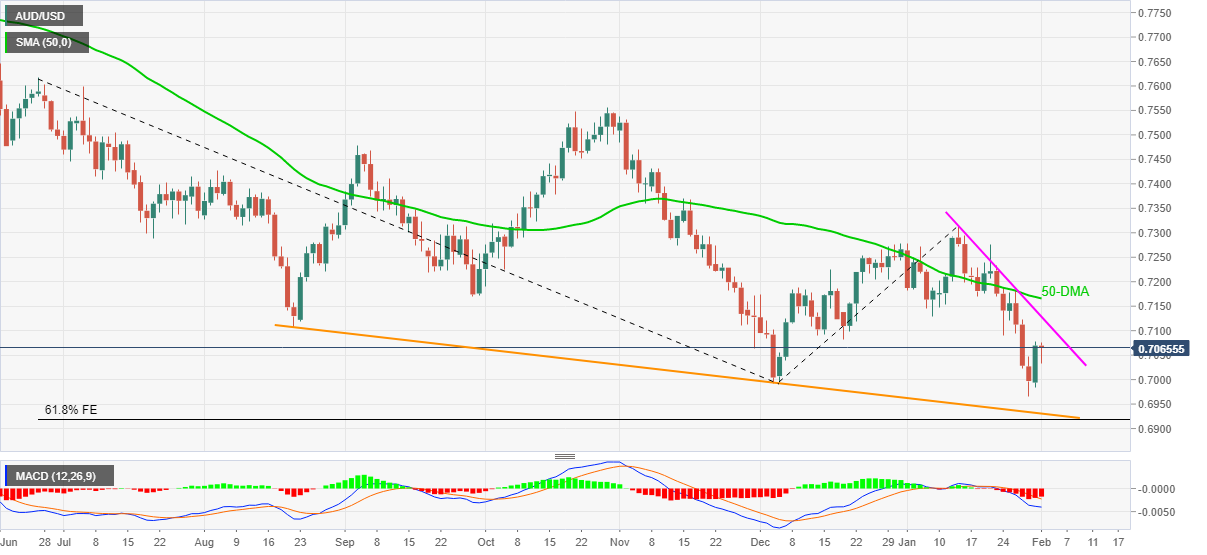
Alternatively, the 0.7000 threshold will precede the year 2021 low and the recent bottom, close to 0.6995 and 0.6965 in that order, to challenge the short-term sellers.
Following that, a downward sloping trend line from August, near 0.6930, will test the quote’s further declines ahead of the 61.8% Fibonacci Expansion (FE) of the late June 2021 to mid-January 2022 upside surrounding 0.6920.