GBP/USD Price Analysis: Seesaws around 200-SMA inside immediate bullish channel
- GBP/USD probes two-day downtrend inside a bullish chart formation.
- Sustained bounce off 50-SMA, steady MACD line keep buyers hopeful.
- Key Fibonacci retracement levels add to the downside filters.
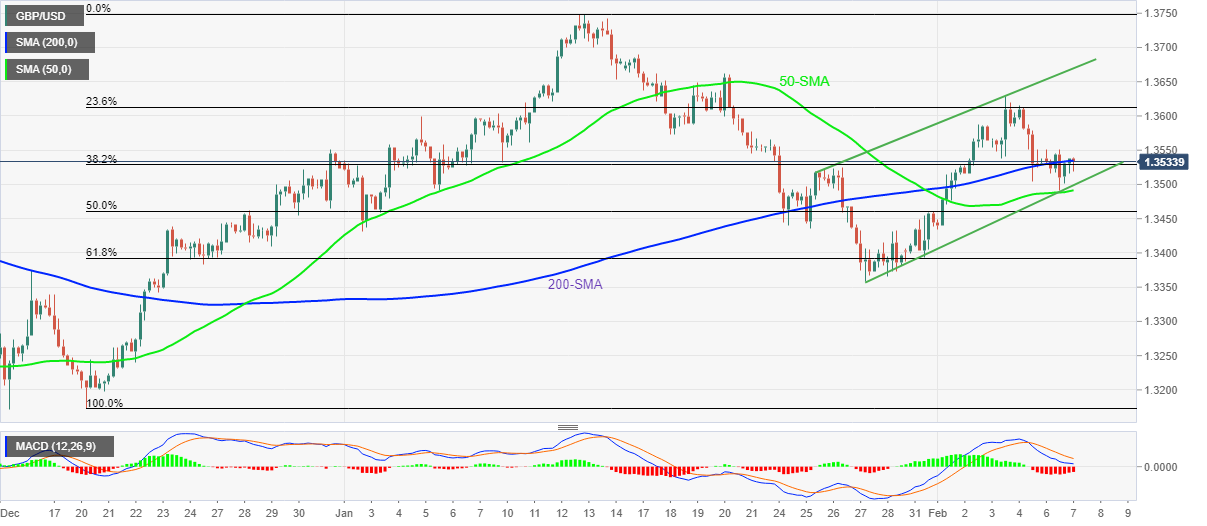
GBP/USD defends the previous day’s bounce off 50-SMA, treading water around 1.3530-35 during Tuesday’s Asian session.
The cable pair dropped to a one-week low on Monday before taking a U-turn from 1.3490, which in turn portrays the two-week-old rising channel formation. Adding to the bullish is the recently steady MACD line in the positive territory.
That said, the pair’s further upside will initially aim for the 1.3600 threshold before challenging 23.6% Fibonacci retracement (Fibo.) of the December-January upside, near 1.3615.
Should GBP/USD buyers cross the 1.3615 hurdle, the upper line of the aforementioned channel near 1.3670 will challenge the additional run-up.
Alternatively, 50-SMA and the support line of the stated bullish channel together offer strong short-term support near 1.3490, a break of which will highlight 50% and 61.8% Fibo. levels for GBP/USD bears, respectively around 1.3460 and 1.3390.
Even if the pair sellers conquer 1.3390 support, the previous month’s low around 1.3355-60 will question the further declines.
GBP/USD: Four-hour chart
Trend: Further recovery expected