Back
24 May 2022
GBP/USD Price Analysis: Bulls pushing against a key level of resistance, 1.2650 eyed
- GBP/USD bulls are in charge and looking for a break of key daily resistance.
- The weekly chart is being corrected with 1.2650 eyed.
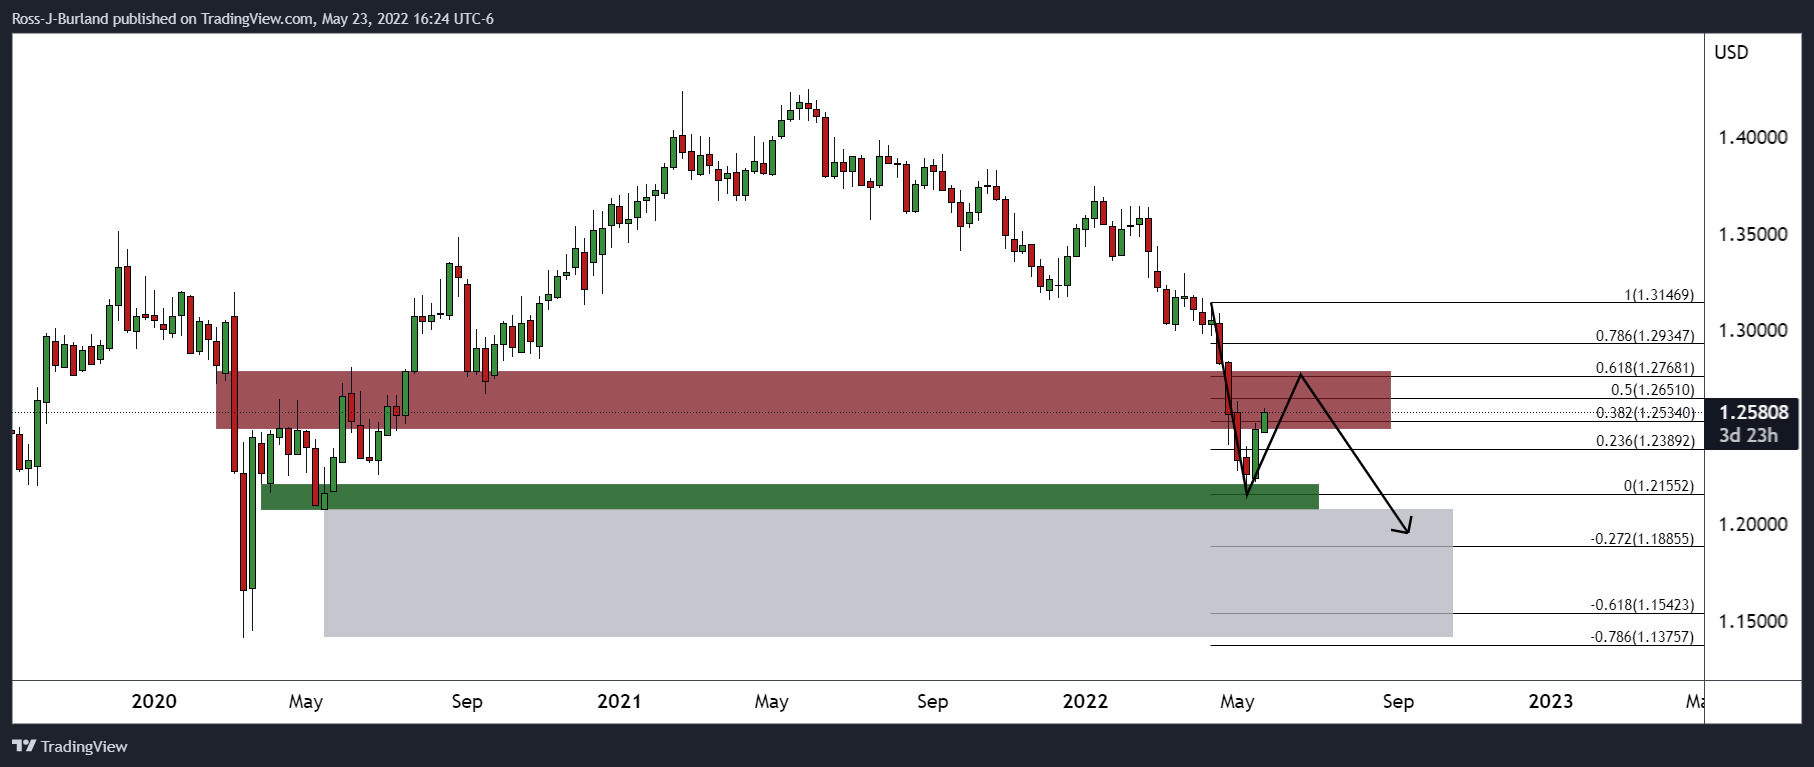
The price is making it's way higher within the correction of the weekly chart's bearish impulse. Having already mitigated some of the price imbalance in a 38.2% Fibonacci retracement so far, the bulls are staying with the course which leaves 1.2650 vulnerable in a 50% mean reversion. Thereafter, the golden 61.8% ratio will be eyed.
GBP/USD weekly chart
On the daily chart, the bulls have broken the first layer of resistance that would now be expected to act as a support on a retest. If the bulls commit, then a break of 1.2650 would expose the void of bids between there and the 1.30s.
GBP/USD daily chart
